EMAs (20,50,100,200)Ability to plot EMAs (20,50,100,200) in single indicator and can be tweaked according to your trading style.
Cerca negli script per "3 ema"
Multi EMA/SMA with Bollinger Bands Combo 1.0This script provides:
5 regular EMAs
5 regular SMAs
3 multiple time frame EMAs
3 multiple time frame SMAs
Bollinger Bands
All features can be turned on/off and customized regarding color, lines, etc.
Excellent for TradingView users with limited or free accounts.

6 EMAs + VWAP by Felipe FacchinIndicador personalizado com 6 EMAs + VWAP. Recomendo utilização do tema escuro e EMAs 50, 100 e 200.

QEMA - 9 EMAs (10, 20, 50 - 400) / CryptoprospaBy adding this one indicator to your chart, you save time and effort for the EMAs you want.
You can add this and then modify which ones you want visible in the settings.
It covers the 10, 20, 50, 100, 150, 200, 250, 300, 400 EMAs
Enjoy.
Cryptoprospa.

Nine Fibonacci EMAsAre you running short on available indicators in your chart?
Here you get 9 EMAs of the fibonacci sequence in one ;)
EMAs 8, 13, 21, 34, 55, 89, 144, 233 and 377.

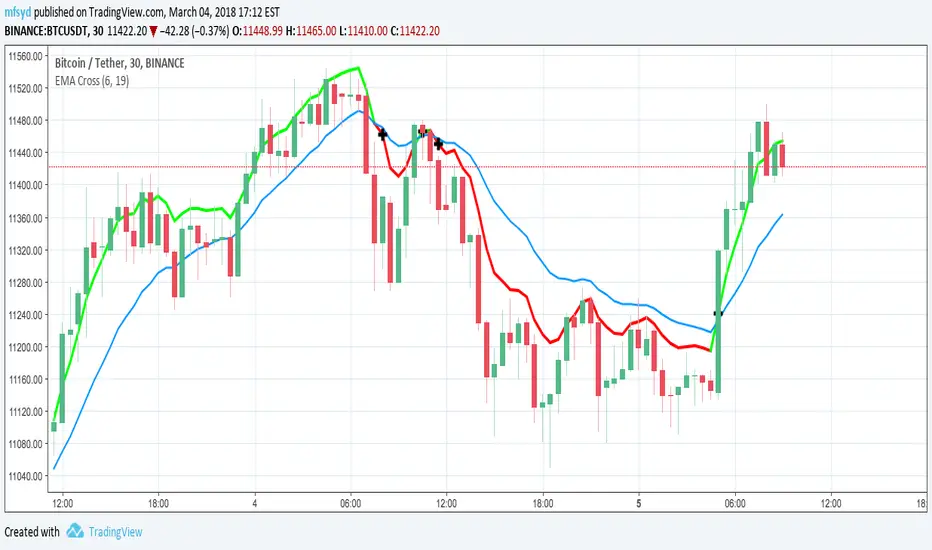
EMA Cross + MACD Signal Cross overlay Einfacher EMA-Cross Indikator mit Indikation der Crosses auf EMA-Linie und am Chart-Bottom +
MACD-Cross wird default an: location.top angezeigt zusätzlich zeigt die Hintergrundfarbe an ob der MACD über (grün) oder unter (rot) seinem Signal liegt.
Double EMA & ALMA StrategyThe ALMA (50 period) acts as the main trend filter, meaning that long positions are taken above the ALMA and short positions are taken below the ALMA. For instance, the 5 and 10 period exponential moving averages are added on the chart to give early signals to the trend.
Therefore, when the 5/10 EMA triggers a bullish crossover, long signals are taken when price is above the ALMA, likewise, when the 5/10 EMA triggers a bearish crossover, short signals are taken when price is below the ALMA.
Find out optimal values by trying. May not produce accurate results in horizontal markets. Thank you.

8/21/100 EMAsBecause we all want to keep our charts clean, I have saved my EMA's configuration in this script.
Follow the green & red background as the buy / sell signal. Always keep an eye on the EMA 100 too.

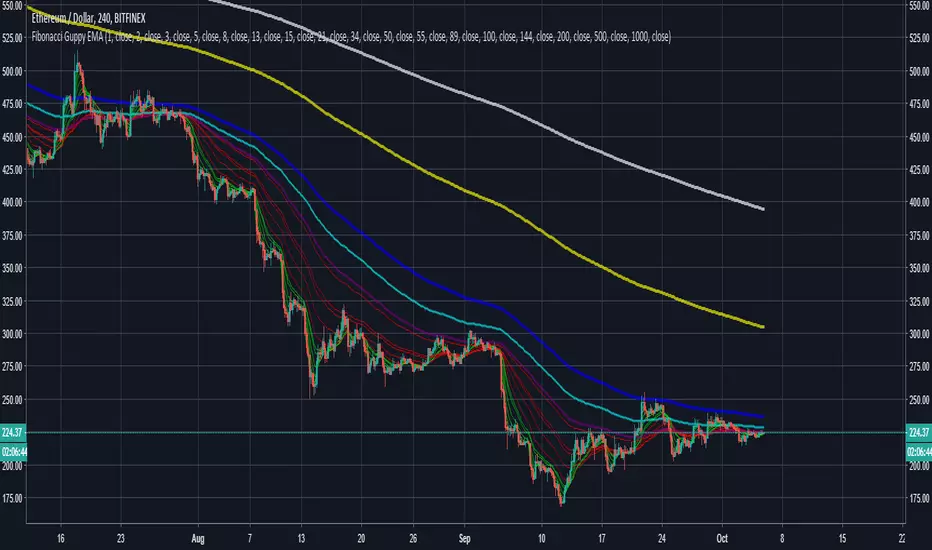
Fibonacci Guppy EMAGuppy EMA that uses fibonacci numbers instead of standard guppy numbers.
EMA's used: 1, 2, 3, 5, 8, 13, 15, 21, 34, (50), 55, 89, (100), 144, (200), (500), (1000)
RSI + BB (EMA) + Dispersion (2.0)First version here
Initial data:
1) RSI
2) Bollinger Bands (Basis - EMA )
3) Dispersion (around basis)
Signal for purchase: RSI crosses the dispersion zone upwards
Signal for sale: RSI crosses the dispersion zone downwards
Buffer zone: white area, it is not recommended to make transactions.
--- Add ( 02.10.2018 )
1) RSI lines (overbought / oversold) = 70 / 30. Сan be changed in the settings.
2) Alerts:
• RSI line crossover Dispersion Zone (green)
• RSI line crossunder Dispersion Zone (red)

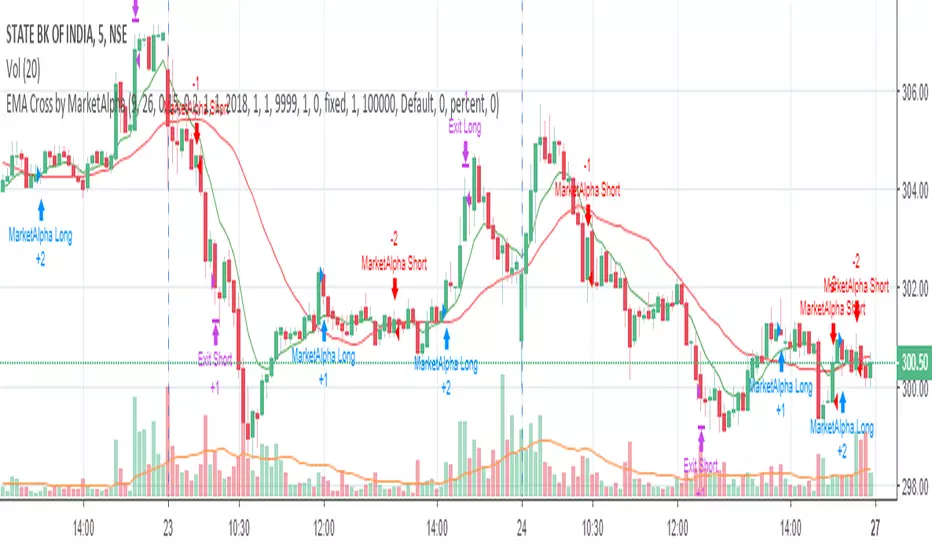
EMA Cross by MarketAlphaSignals are generated when EMA(FastLength) and EMA(SlowLength) cross each other.
Below are the additional user parameters:
1. User defined backtesting period
2. User defined Target and StopLoss percentage points
Fibonacci EMAFibonacci EMAs (8,13,21,34,55) and Slow EMAs (100,200) for trend as well as S/R determination
smag ema distanceThis script will plot an ema of defined lenght with two lines at predefined %-distances from that ema

SMA/EMA 12|26|50SMA/EMA 12|26|50
Exactly as title says
SMA is bold
EMA is light
Orange 12
Green 26
Blue 50

EMA 55 CrossoverBasically what this does is to flag when EMA 55 crosses over EMA 8, 13, 21, and 200. This strategy was described by @Philakone on this tweet , but I'm not really sure if this is the correct strategy he described.
Multiple Ema 20/50/100Multiple Ema 20/50/100 and you can add more EMA Plot easily by changing the codes.

EMA 9/12/21/55 in one placeBased on --> // Inspired by Philakone's 55 EMA Swing Trading Strategy
- Increased EMA line visibility
- Removed buy/sell arrow

SW Magic Signals EMA [Sergio Waldoke]// SW Magic Signals EMA , shorttitle="MagicSignalsEMA"
// Script created by Sergio Waldoke (BETA VERSION v0.99)
// Buy Long when you see a Green buy arrow
// Sell Short when you see a Red sell arrow
// Basis Signal is the difference between EMA's. When the difference change from increase to decrease or inversely, signals are triggered
// Step signal shows if difference increases or decreases

EMA CrossA single Indicator that has two EMA inputs (currently using 9, 16 for my crypto trading)
On a cross the color of the Fast movign EMA changes , and a cross gets indicated at the cross point.
This can then be used to set alerts moving up and down
Low EMA of EMAgain over the chart for ProfitTrailerThis script prints low EMA line over the chart.
Buy value and time frame numbers can be modified in format.
Basically this is same with previous scripts of mine.
Though this does not show the spread between the price and low EMA line (EMAgain) and buy value, you can see the buy trailing signal.
If you set buy value positive for gain starategy, the buy trailing will start from the time point indicated by "▲".
If you set buy value negative for gain starategy, the buy trailing will start from the time point indicated by "▼".
This script is to help myself understand the buy strategies of ProfitTrailer.
Any comments and suggestions are welcome.


Moving Average Colored EMA/SMAThis script will give you the ability to put an EMA and/or SMA on the chart that changes color based upon the direction. Default at startup is EMA visible and SMA hidden. When the MA is moving up, it is green. When the MA is moving down, it is red. You can change the color to whatever you like.
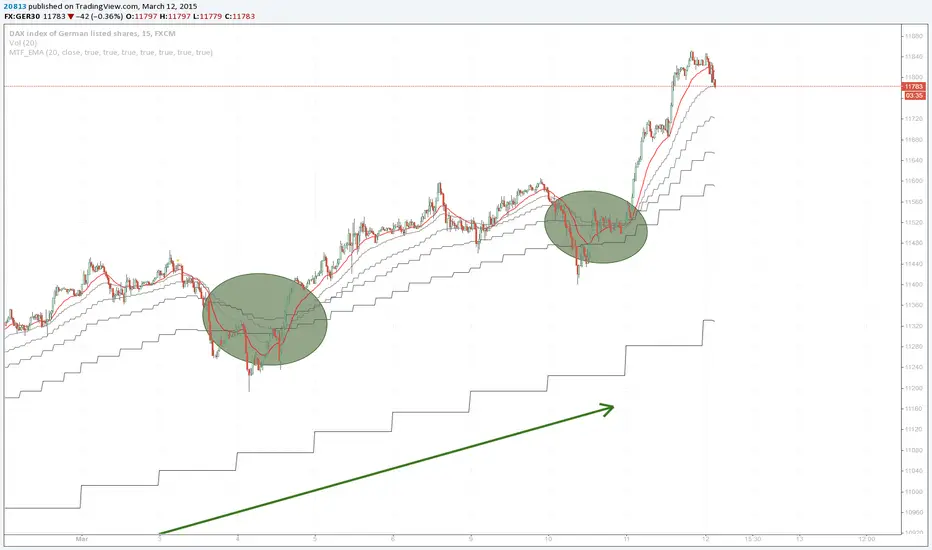
Multi Timeframe EMAThis indicator will show you the exponantial moving average (ema) of the higher timeframes (up to 1D). Current timeframe is colored red, higher timeframes are colored from light to dark gray (you can change this).
How to Trade this:
1. Look for tranding ema on higher timeframe (line is stepping up).
2. Look for faster time frames to pull back (decline) to a higher timeframe.
3. This is a good area to look for a buy entry (vice versa for sell entry).
Don't fight the trend :)
Updated Version: